Paleogene uplift and erosion of the Western Barents Sea
In the Barents Sea, the major Paleogene uplift triggered the re-migration of hydrocarbon. In order to better understand this phenomenon, it is crucial to assess the amount of uplift, net erosion and its timing.
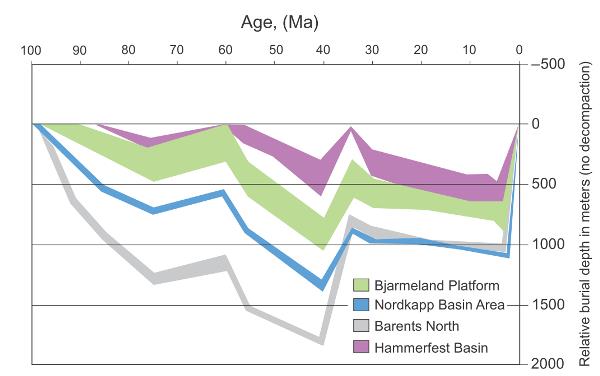
Timing
The figure below shows subsidence curves for different parts of the Barents Sea. Three main episodes of uplift are shown at roughly 60 (Paleocene), 33 (Oligocene) and 5 Myr (Pliocene-Pleistocene), the latter two being most significant (Ohm et al., 2008).
The fission track analysis indicates two distinct periods of uplift and erosion. The first phase took place about 40-50Myr ago (being roughly the average age of the first episodes) and the second phase about 5-10Myr ago (Nyland et al. 1992).
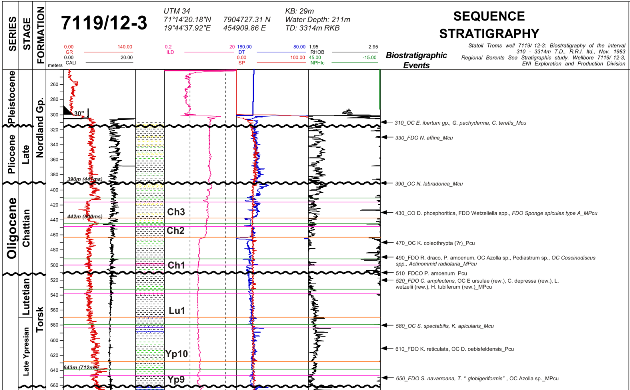
Our observations on well 7119/12-3 indicate dated Late Oligocene sediments overlying a long duration hiatus and confirm a major phase of uplift at pre Late Oligocene time (from 33 Myr to 28.5 Myr, see figure below).
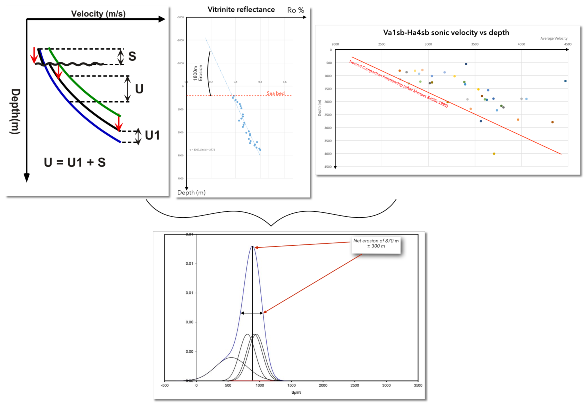
Quantification
In order to better quantify the amount of uplift from the 76 Barents Sea wells, three different methods (velocity versus depth profiles, shale compaction, vitrinite reflectance) have been combined using a statistical approach.
The statistical approach helped to reduce the uncertainty on the amount of uplift by keeping the most probable value and by discarding the outliers.
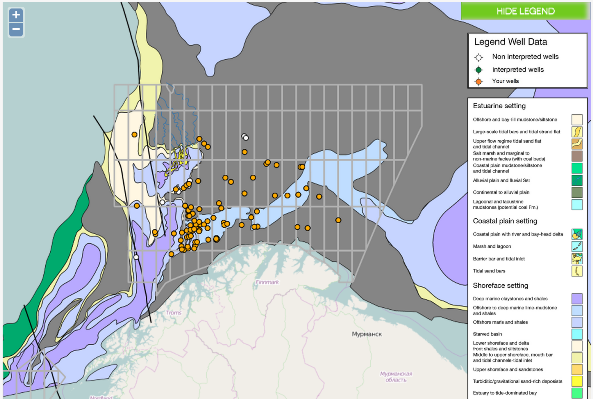
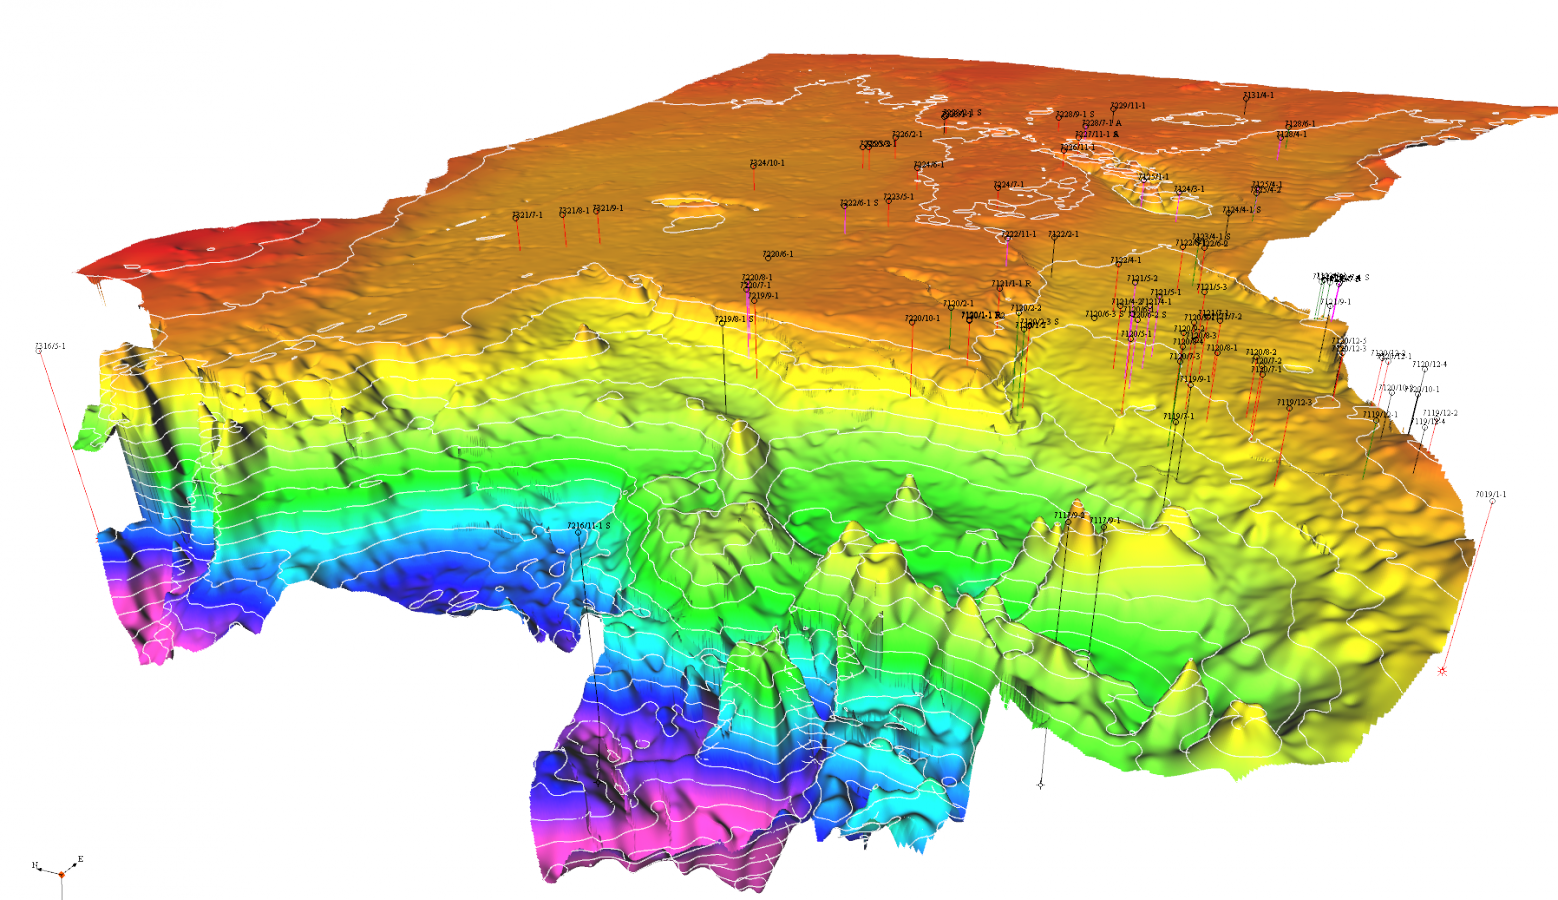
Mapping
The evaluation of Cenozoic sequences is conducted by a detailed mapping of 9 key horizons:
- Base Pleistocene
- Late Pliocene Unconformity
- Late Oligocene Unconformity
- Late Eocene Unconformity
- Lu2sb
- Yp4mfs
- Th6mfs
- Da1sb
- Base Campanian Unconformity
Restoration
Thanks to the Cenozoic regional mapping and our interpreted well database, 7 paleogeographical maps can be designed. Combining with the geometries visible on the seismic lines, we propose a paleobathymetric restoration of these 7 intervals:
- Paleocene
- Early Eocene
- Late Eocene
- Oligocene
- Miocene
- Pliocene
- Pleistocene